

By Pawel Siwek, Product Manager at Dynatrace
September 22, 2015
SAP applications play a key role in fulfilling business processes in today’s digital enterprises. Availability problems, even those that impact single users, result in efficiency loss and in a worst case scenario may even stop the process. From an IT operation perspective it is a challenging task to isolate and identify the root-cause of intermittent availability problems for a single user, when the application seems to run fine for everyone else.
Given the complexity of the typical SAP systems landscape, it may be even more difficult; 71% of executives say it takes hours, days or even weeks to pinpoint the cause of such SAP performance issues[1]. Given the costs of poor SAP performance and time it takes to address the issues once they impact SAP users, the progressive application managers responsible for SAP application delivery look for performance analytics tools that would enable them to find and fix the performance potholes before end users fall into them. At Dynatrace we always look to support those who prefer avoiding problems rather than reacting to them. Here we’d like to share an example of how the Transaction-Centric Performance Management approach inherent to Dynatrace DC RUM enables an SAP Basis team member to pinpoint a looming SAP transaction slowness issue:
- Gather objective evidence that the problem exists
- Assess the business impact of the problem
- Isolate the problem to specific transactions
- Track the root cause at the database tier
From Dashboard to Diagnostics
The triggering event for this investigation is the fact that there are recurring anecdotal reports of “SAP is slow” incidents that cannot be attributed to specific events known to the Basis team, the DBAs, or the Network team. The issues reported by users cannot be reproduced by troubleshooting teams. Nor is the problem location specific – it is being reported from multiple offices.
To begin, we will use the ‘Application Health Status’ dashboard that summarizes current application health, availability and usage status, along with trends from the last 24 hours. SAP ERP is one of the critical business applications that is part of the broader monitored application portfolio.
Figure 1

The first observation is that overall SAP system health is good (Figure 1); there are no network issues and the whole SAP delivery chain (SAP GUI, Database, RFC integration) is also performing fine. At the same time, 6% (3) of the users are affected by performance problems. Digging a little deeper we can see that SAP system health is at 99.9% – in other words, just 0.01% of the total transactions were affected by availability or poor performance.
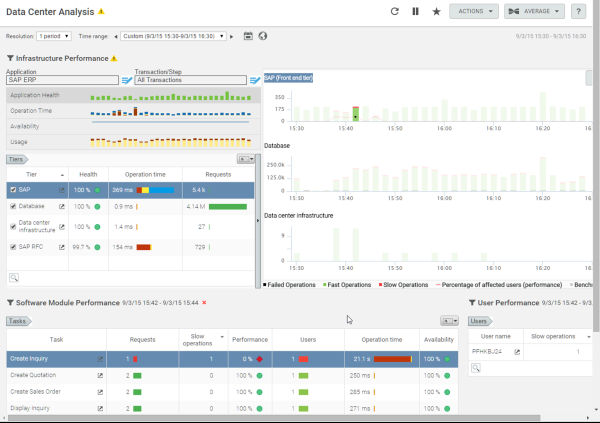
For further investigation, we’ll drill into the ‘Data Center Analysis’ report (Figure 2) that provides detailed performance and usage trend across SAP tiers (SAP GUI, Database, and Middleware), the performance of all SAP transactions, and the names of affected users.
Figure 2

Here we may notice that there were some slow SAP GUI operations between 15:38 and 15:42 (Figure 2). To identify which of them were slow, we’ll next narrow down the view to this timeframe.
Figure 3
Now it’s clearly visible that the ‘Create Inquiry’ transaction is the slow one (Figure 3), with operation time 21.1s, affecting the user PFHKBJ24. We are also able to see that other transactions that were executed in the same time range – ‘Create Quotation’, ‘Create Sales Order’ and ‘Display Inquiry’ – are performing normally, having taken no more than 300ms. To isolate the cause of the problem we will change the context from SAP GUI front-end monitoring to the SAP backend – taking first the database tier.
Figure 4
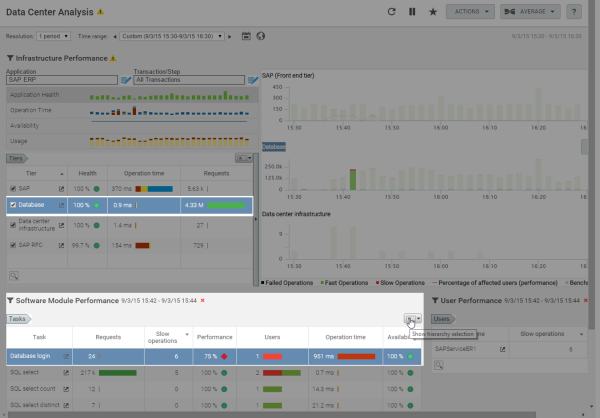
The resulting report (Figure 4) shows all the queries that were executed within the analysed timeframe, and it’s easy to identify that there were six slow ‘Database login’ operations executed by the system user SAPServiceER1.
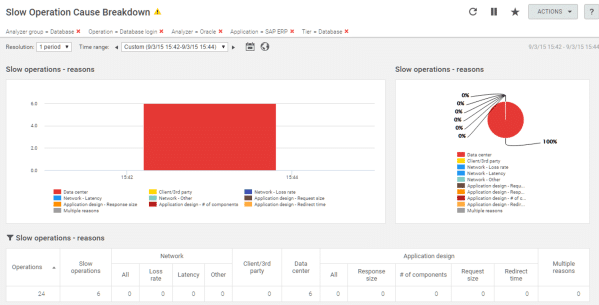
The ‘Slow Operation Cause Breakdown’ view below (Figure 5) provides detailed information about the reason for the slow operations. In our case, ‘Data Center’ was the only reason, which means that most of the operation time was spent on the database server. At this point, the issue may be referred directly to the DBA team, providing them with details of the time when performance problem happened, the operation details including query parameters, and the user name.
Figure 5
Dynatrace Data Center Real User Monitoring (DC RUM) is the solution that will help you identify and proactively solve performance and availability problems – even those occurring for single users. Its transaction-centric, non-intrusive network monitoring architecture provides availability and performance insight into all SAP transactions, for all network locations, for all users. DC RUM isolates fault domains across the entire SAP application delivery chain, including Citrix SAP GUI provisioning, network components, SAP NetWeaver application servers, and database servers, as well as integrations with other supporting systems.
If you’ll be attending SAP TechEd in Las Vegas in October, come say hello to us at Booth #114.
[1] 2014 SAP Performance Survey and Puppet Labs State Of DevOps Report
About The Author
Pawel Siwek is a Product Manager at Dynatrace, focusing on application performance management for SAP, Microsoft, Oracle and enterprise applications. Prior to joining Dynatrace, Siwek spent over a decade as a .NET software developer/architect in the finance industry where he gained practical knowledge of enterprise application architectures and common performance challenges. In his role as a Business Consultant at SAP he expanded his knowledge into the SAP systems landscape as well as large-scale system deployments in global IT organizations.

